WB Dashboard
A dashboard to visualize the World Bank data
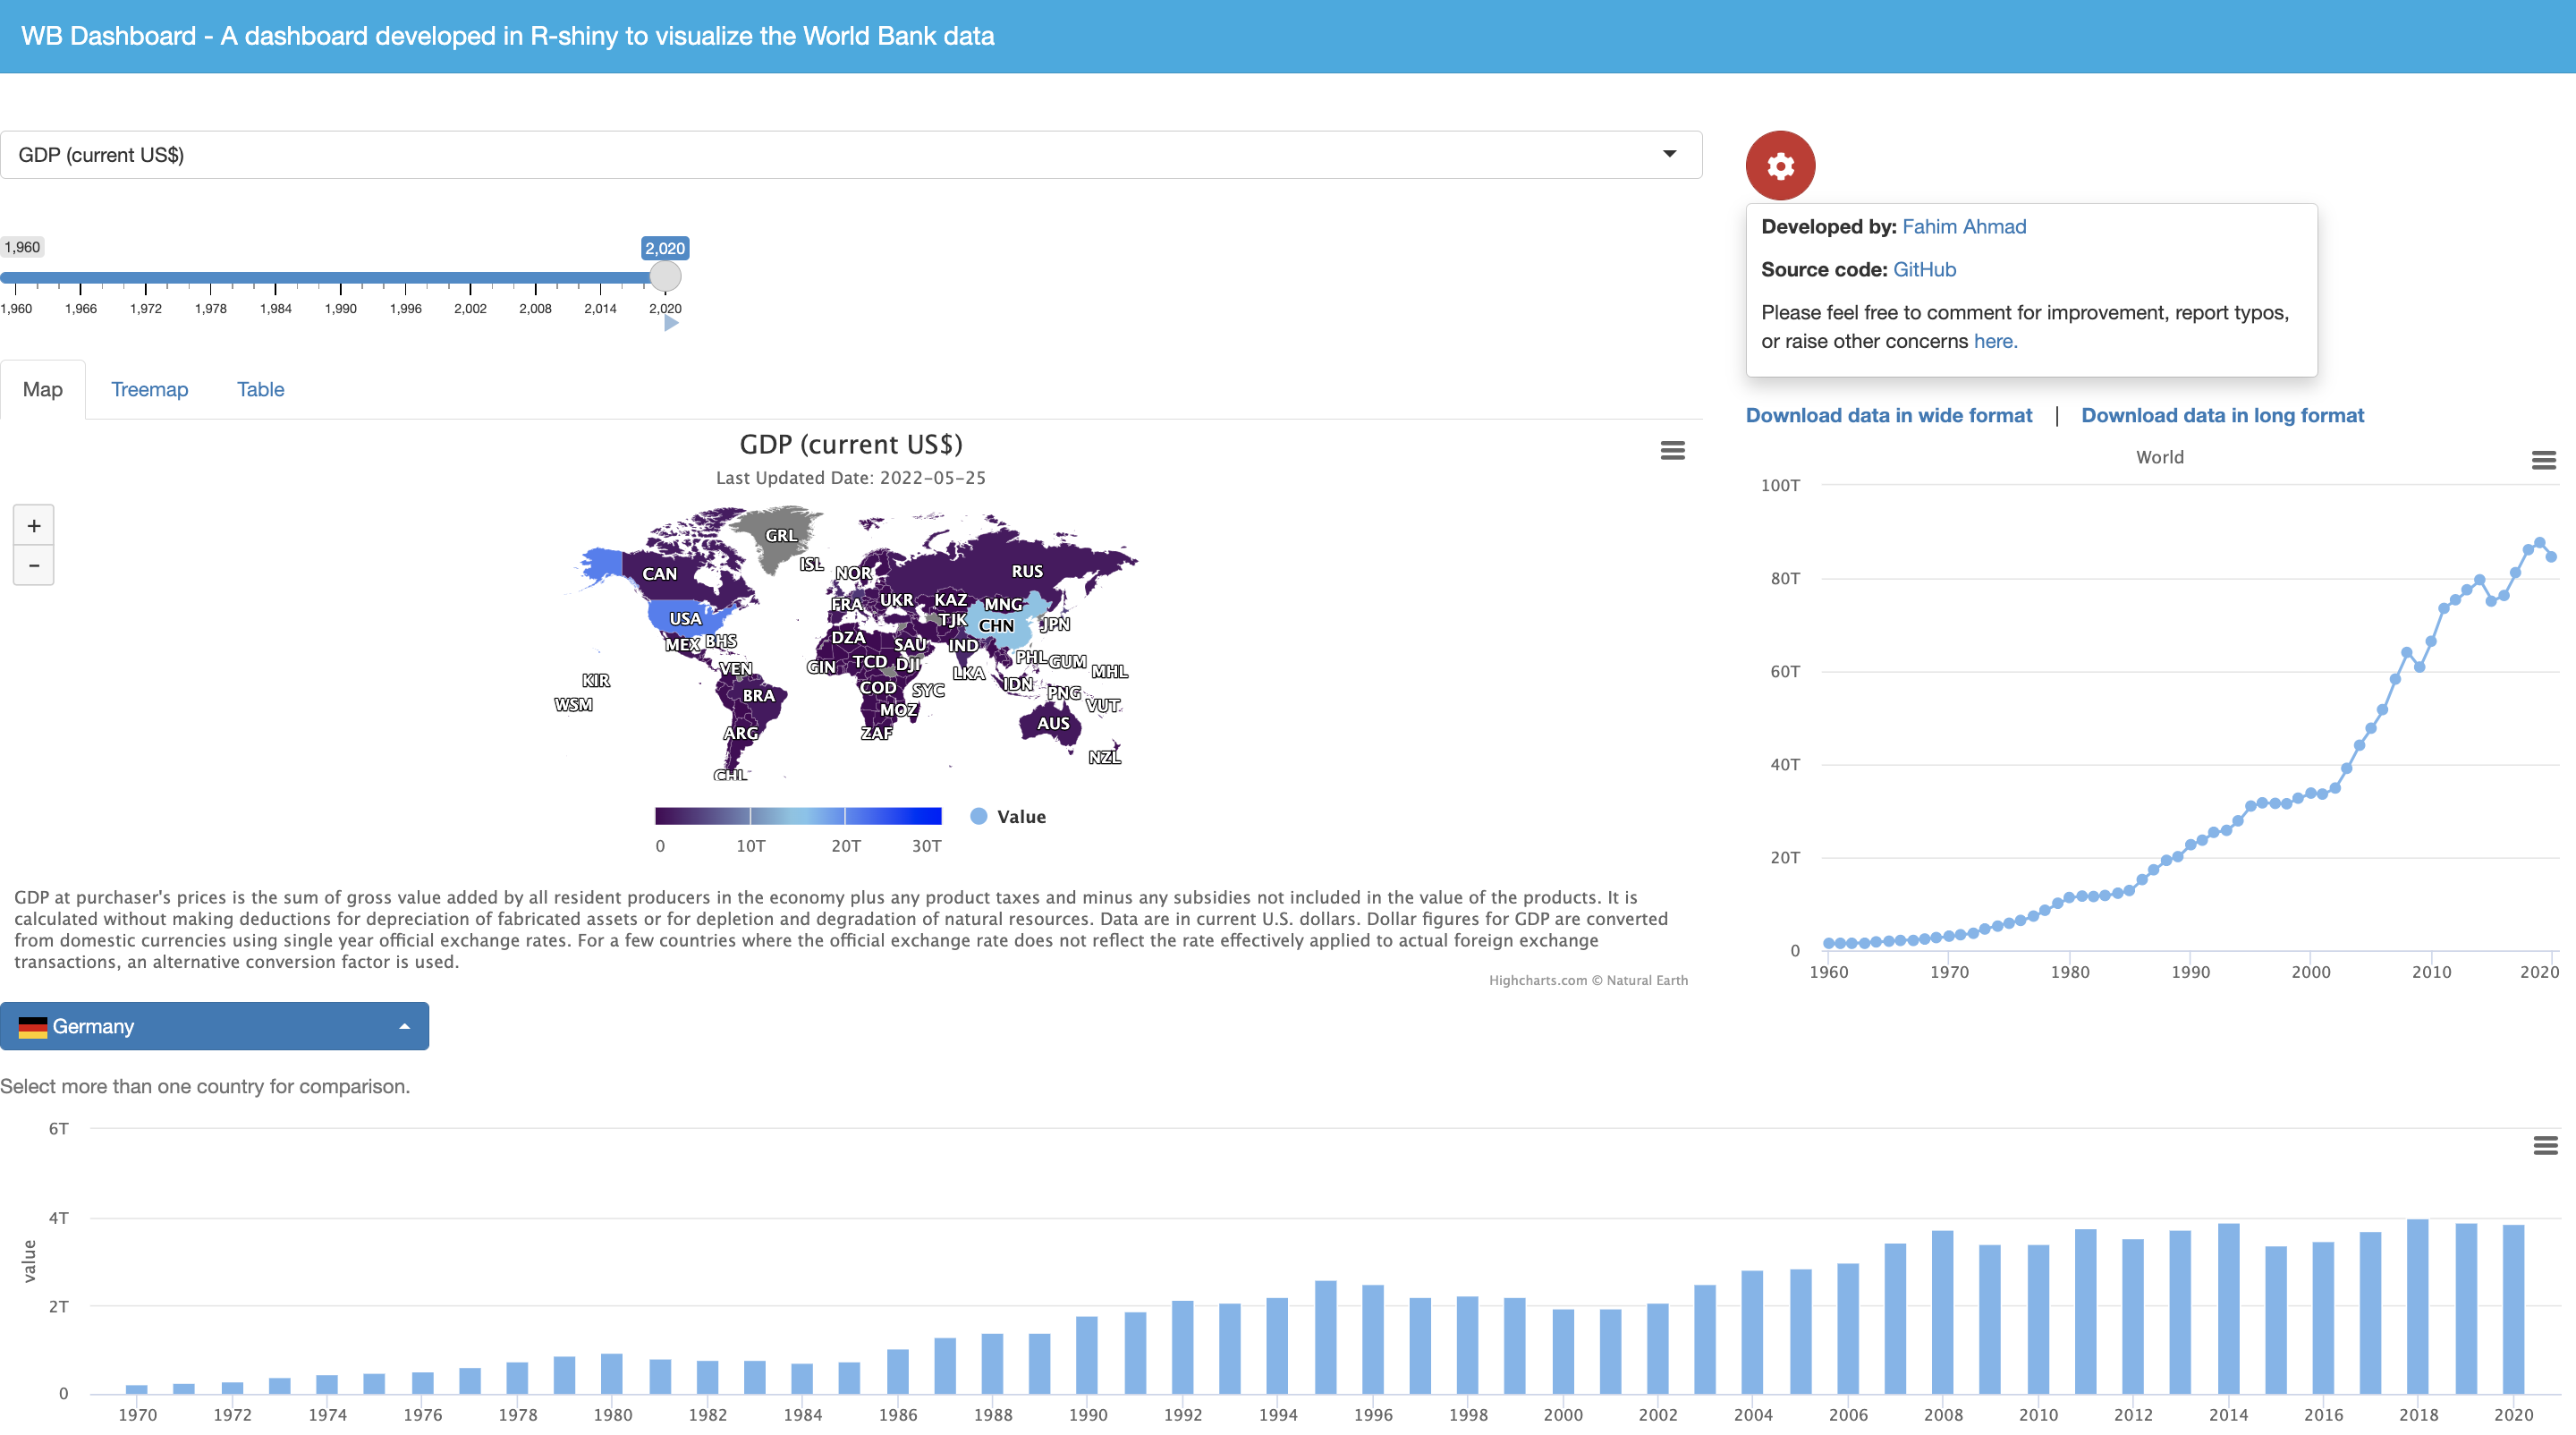
I developed this dashboard to visualize the economy & growth related indicators from the World Bank (WB).
It is very simple to use. You select an indicator and it depicts the most recent values of the selected indicator in a map (the first tab of the tabset-panel) and in a treemap (the second tab of the tabset-panel).
It also shows the increase and decrease of the selected indicator over years for a country or a comparison between two or more than two countries.
Additionally, you can download the data in a wide format as well as in a clean and analysis-ready long format.
Source code: https://github.com/Fahim-Ahmad/wb_dashboard
If you have a working knowledge of R, please use the source code from my GitHub account as I am using the free version of the shinyapps.io which has limited usage.
Please click on the below image to use the dashboard: