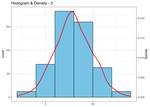
The geom_histogram() function from ggplot2 package is used to create a histogram plot. For example, let’s plot the distribution of Sepal.Length from iris data.
library(ggplot2) theme_set(theme_bw()) ggplot(iris, aes(Sepal.Length)) + geom_histogram(fill = "orange") To add a vertical line to show the mean value of Sepal.