What is Central Tendency?
Before going directly to measures of central tendency, I want you to look at the data below. This is a table of weekly expenditures of two projects over the course of 10 weeks. Now tell me which one is cost-efficient than the other, or both are the same?
## Warning: package 'dplyr' was built under R version 4.0.5| project1 | project2 |
|---|---|
| 10000 | 10500 |
| 15400 | 15000 |
| 14250 | 14300 |
| 13000 | 12500 |
| 11250 | 11300 |
| 10450 | 10500 |
| 9035 | 9030 |
| 12500 | 12500 |
| 14125 | 14120 |
| 11240 | 11320 |
What if I show you this?
| projects | average |
|---|---|
| project1 | 12125 |
| project2 | 12107 |
Using the average, it is easy to compare the expenditures of both projects. This is one of the primary purposes of the measures of central tendency to summarize the data into a single number that represents the center point of the data.
Measures of central tendency show the point where most values of a the data fall and represent the tendency of the data to cluster around a middle value using different approaches. Selecting the appropriate method, however, depends on the type of data you are dealing with. In this post, you will learn when to use a particular measure of central tendency and how to calculate it using R.
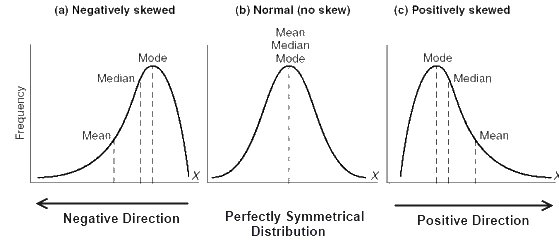
- Mean: Mean is the measure of central tendency that you are most familiar with. Its use is most often with continuous data. You just add up all of the values and divide by the number of observations in the data. The mean locates the center accurately when the data is normally distributed. In fact, in any symmetrical distribution the mean, median and mode are equal. You can, therefore, use any of the measures of the central tendency to locate the center of the data. However, the presence of extreme values pulls the mean away from the center while the median is less affected by outliers.
As mean is susceptible to the presence of outliers1, it loses its ability to provide the best central location when the data is skewed. As the above figures show that mean is dragged in the direction of the skew. Thus, using only the mean to approximate the center of the data can often be misleading.
In R, the mean() function can be used to calculate the arithmetic mean. It takes a vector of values as input and returns the average.
# use (na.rm = TRUE) if there is any missing value in the list of values
mean(c(10000, 15400, 14250, 13000, 11250, 10450, 9035, 12500, 14125, 11240), na.rm = FALSE)
## [1] 12125- Median: Median is the middle point of the data that is arranged in ascending or descending order. If a dataset contains an even number of values, the median is the mean of the two middle values. In other words, the median is the middle of an ordered list of values. Median is less likely to be influenced by the presence of outliers. Therefore, it is the most preferred measure of central tendency when the distribution of the data is skewed. Moreover, the median is used when there is an open-ended distribution. For example, if you have data that measures numbers of employees and the options are 1, 2, 3, 4, “5 or more”. The “5 or more” option is open-ended and the exact value is unknown. Thus, it makes calculating the mean impossible.
The median() function can be used to compute the median. It takes a vector of values as input and returns the value that is occurred most frequently.
# use (na.rm = TRUE) if there is any missing value in the list of values
median(c(10000, 15400, 14250, 13000, 11250, 10450, 9035, 12500, 14125, 11240), na.rm = FALSE)
## [1] 11875- Mode: Mode is preferred when you have a categorical data. It is not often used with the continuous data because there are an infinite number of values between two values and it is very unlikely that two or more values will be exactly equal. Mode represents the most common value -the value that occurs most frequently- in the data. In some cases, a dataset may contain multiple modes while some datasets may not have any mode at all
To the best of my knowledge, there is not any built-in function in R to find out mode in a vector of values. Therefore, below two steps must be followed:
- count the frequency of each value using
table()function. - use the result of the first step as an input into the
which.max()function to find the mode.
Also, you can use below code to program a new function called Mode to find the mode in a given vector of values.
Mode <- function(x) {
  as.character(
    pull(
      filter(
        data.frame(
          table(x)
        ),
        Freq == max(Freq)),
      x)
  )
}

Mode(c(2, 4, 7, 2, 3, 2, 5, 7, 9))
## [1] "2"The following table shows what the best measure of central tendency is with respect to different types of variables.
| Types of the variable | The best measure of central tendency |
|---|---|
| Nominal | Mode |
| Ordinal | Median / Mode |
| Continuous (not skewed) | Mean |
| Continuous (skewed) | Median |
Outliers are values that are notably different from the rest of the data. Usually, any value larger than 1.5IQR above the third quartile or lower than 1.5IQR below the first quartile is considered as outlier.↩